Load Testing Learnings Using Locust And AWS
High amounts of traffic can lead to a web developers most exciting times but also their most challenging times.


High amounts of traffic can lead to a web developers most exciting times but also their most challenging times. In my work at the company I co-founded (now known as Fullscreen Direct) we've become quite familiar with high traffic spikes in very short timeframes. For example, our platform has had to handle tour announcements from acts such as Metallica and Eric Church. During events like these thousands and thousands of fans all come at the same instant in time in order to get access to better tickets.
Preparing for these events is very important. In doing so we've learned a lot about where bottlenecks are likely to occur as well as which tools work well for exposing those bottlenecks.
Infrastructure Preparation
Fullscreen Direct is a monolithic LAMP stack hosted on AWS. We also make use of Redis and RabbitMQ. Before being able to load test our platform we had to replicate the entire infrastructure so that our load tests would not affect production traffic.
Having to replicate an entire infrastructure is a great exercise in finding where your codebase may not be as portable as it should be. One of the main changes to the codebase we had to make first was moving more elements in to configuration. This allowed us to have much finer control over how various parts of our platform operated in different environments.
Once this was done, spinning up additional AWS services was pretty straightforward. Then we simply needed to deploy our code to the new infrastruture and swap out URLs in the config to point to the load testing hardware.
Running The Tests
For running the load tests we settled on using Locust, an open source load testing tool. This coupled with AWS Elastic Beanstalk gave us all the flexibility we needed.
With Locust you essentially write tests in Python that replicate whatever user behavior you want. In our case we wanted to replicate traffic to common pages that were hit during tour announcements such as the event listing page and fan club pages.
Below is a large chunk of the code we used to replicate this user behavior. The on_start method is called before each test and allows us to create a logged in session for each fake user. Then we use weighted tasks (via @task(30)) to have those users randomly hit the pages we desire.
We also had an extra layer of complexity we wanted to replicate: loading iframes. Locust only makes the requests you tell it to, it doesn't load additional assets in a request (CSS, etc) like a browser would. After each successful page load in the code below we then also make a second request to load the iframe present on each page. This more closely replicated our production traffic patterns.
class DemoSiteLoggedInUserTaskSet(TaskSet):
    user_id = None

    def load_iframe(self, url):
        iframe = hosts.iframe_url + '/' + url
        self.client.get(iframe, name="Logged In iframe: " + url)

    def on_start(self):
        user = users.get_random_for_login()
        with self.client.post('/login',  name="Log In", catch_response=True, data={
            'email': user.get('email'),
            'password': user.get('password'),
            'rememberMe': 1
        }) as response:
            response_data = response.json()
            if not response_data.get('success'):
                if response_data.get('error') is None:
                    return response.failure(response_data)

                return response.failure(response_data.get('error'))

            self.user_id = response.cookies.get('userId')
            if not self.user_id:
                return response.failure('No "userId" cookie set')

    @task(30)
    def fanclub(self):
        with self.client.get('/demo/fanclub', name="Logged In Fan Club", catch_response=True) as response:
            if response.ok:
                self.load_iframe('demo')

    @task(30)
    def events(self):
        with self.client.get('/demo/events', name="Logged In Event Page", catch_response=True) as response:
            if response.ok:
                self.load_iframe('demo')

    @task(30)
    def store(self):
        with self.client.get('/demo/store', name="Logged In Store Page", catch_response=True) as response:
            if response.ok:
                self.load_iframe('demo/store')

class LoggedInUserDemoSiteLocust(HttpLocust):
    weight = 20
    task_set = DemoSiteLoggedInUserTaskSet
    host = hosts.core_url
    min_wait = 1000
    max_wait = 10000
One piece of advice for this part of the process is that creating a spreadsheet to keep track of the tests I was running was invaluable. Once you've spent a couple of hours running tests it quickly becomes impossible to remember how much traffic you were sending and what the relevant results were across the tests.
The headers on this speadsheet I created are below. Locust gives you control over two metrics, users (total number of visitors to send) and users / per second (how quickly to ramp those users up). Those were important to track to know at what load systems started to fail. I also tracked links to any articles I found while researching bottlenecks as well as what part of the infrastructure was my main focus in various tests.
Date | Time | Changes | Focus | Users | Users / Second | Results | Notes | Links
Analyzing Results
Bottlenecks in handling high traffic can come from anywhere. Sometimes it's a hardware issue, sometimes it's a configuration issue, and most of the time it's issues from within your code. We used a combination of software for analyzing the results of our tests.
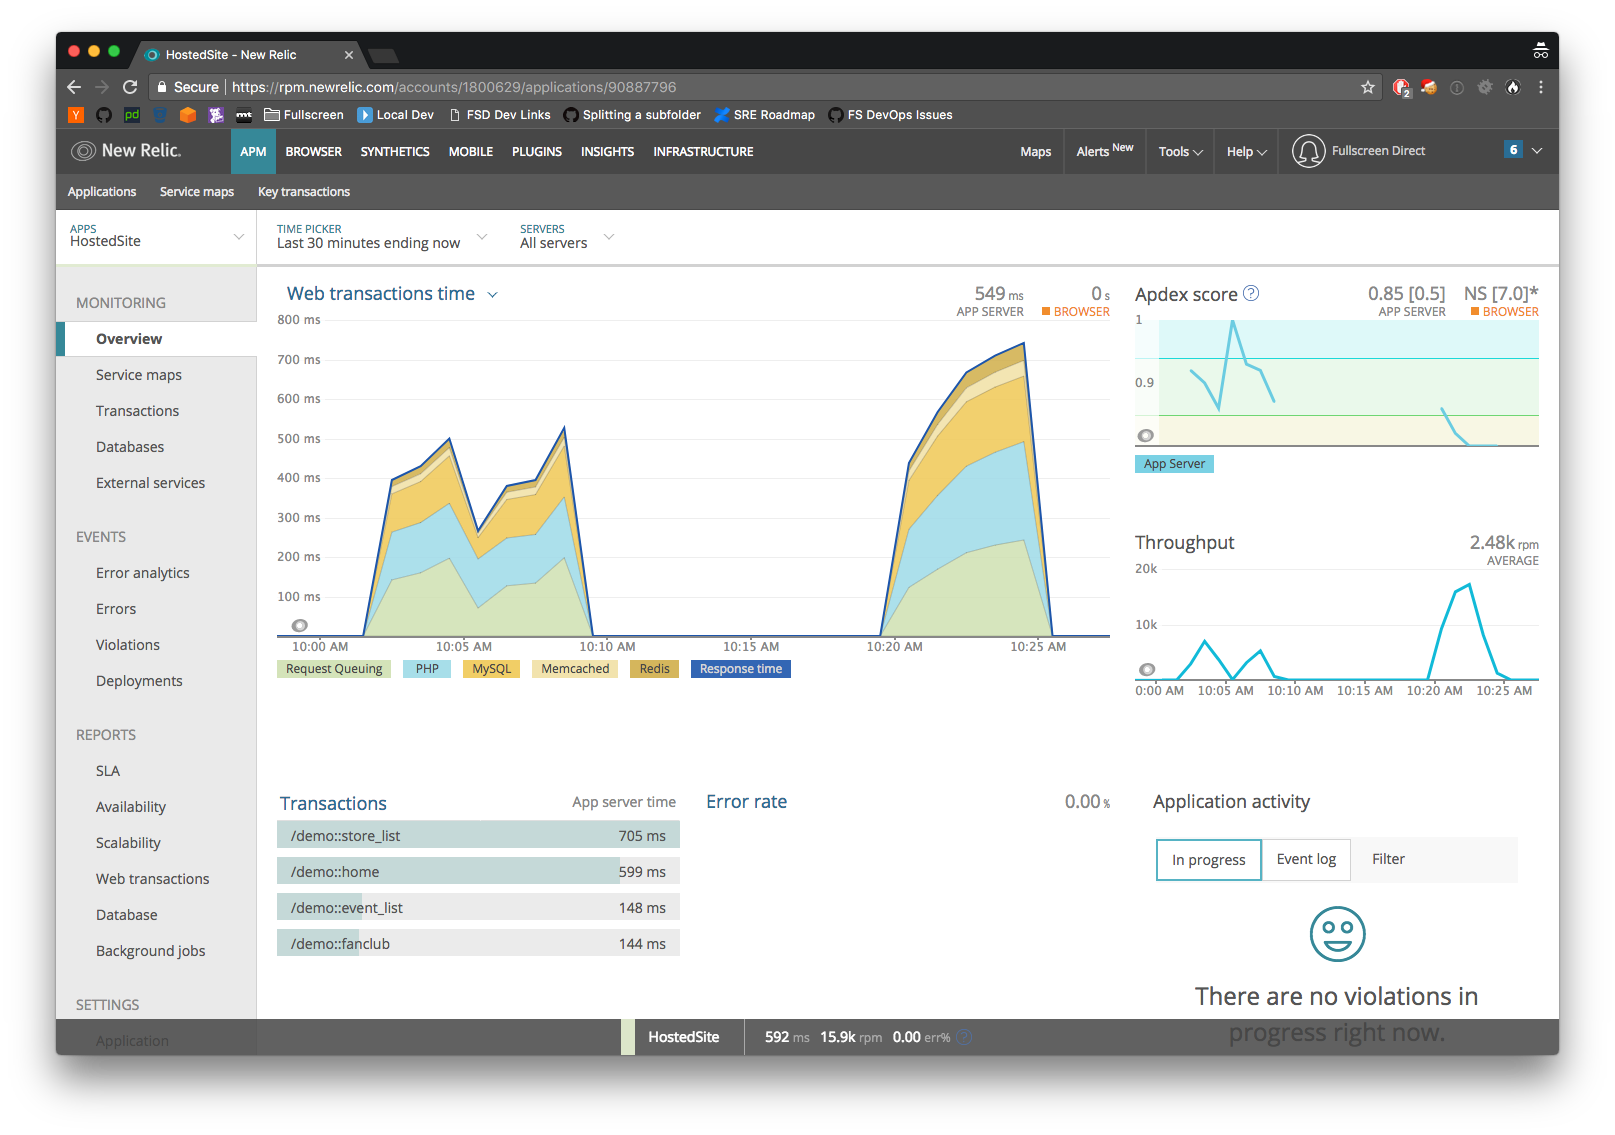
To get a good picture of all the elements at play we rely on New Relic. This not only lets us see how much time is spent in each subsystem, it also enables us to drill down and uncover code paths that are taking longer than they should. For instance, the image below shows two different tests each with a different amount of load and how long the responses took in those situations.
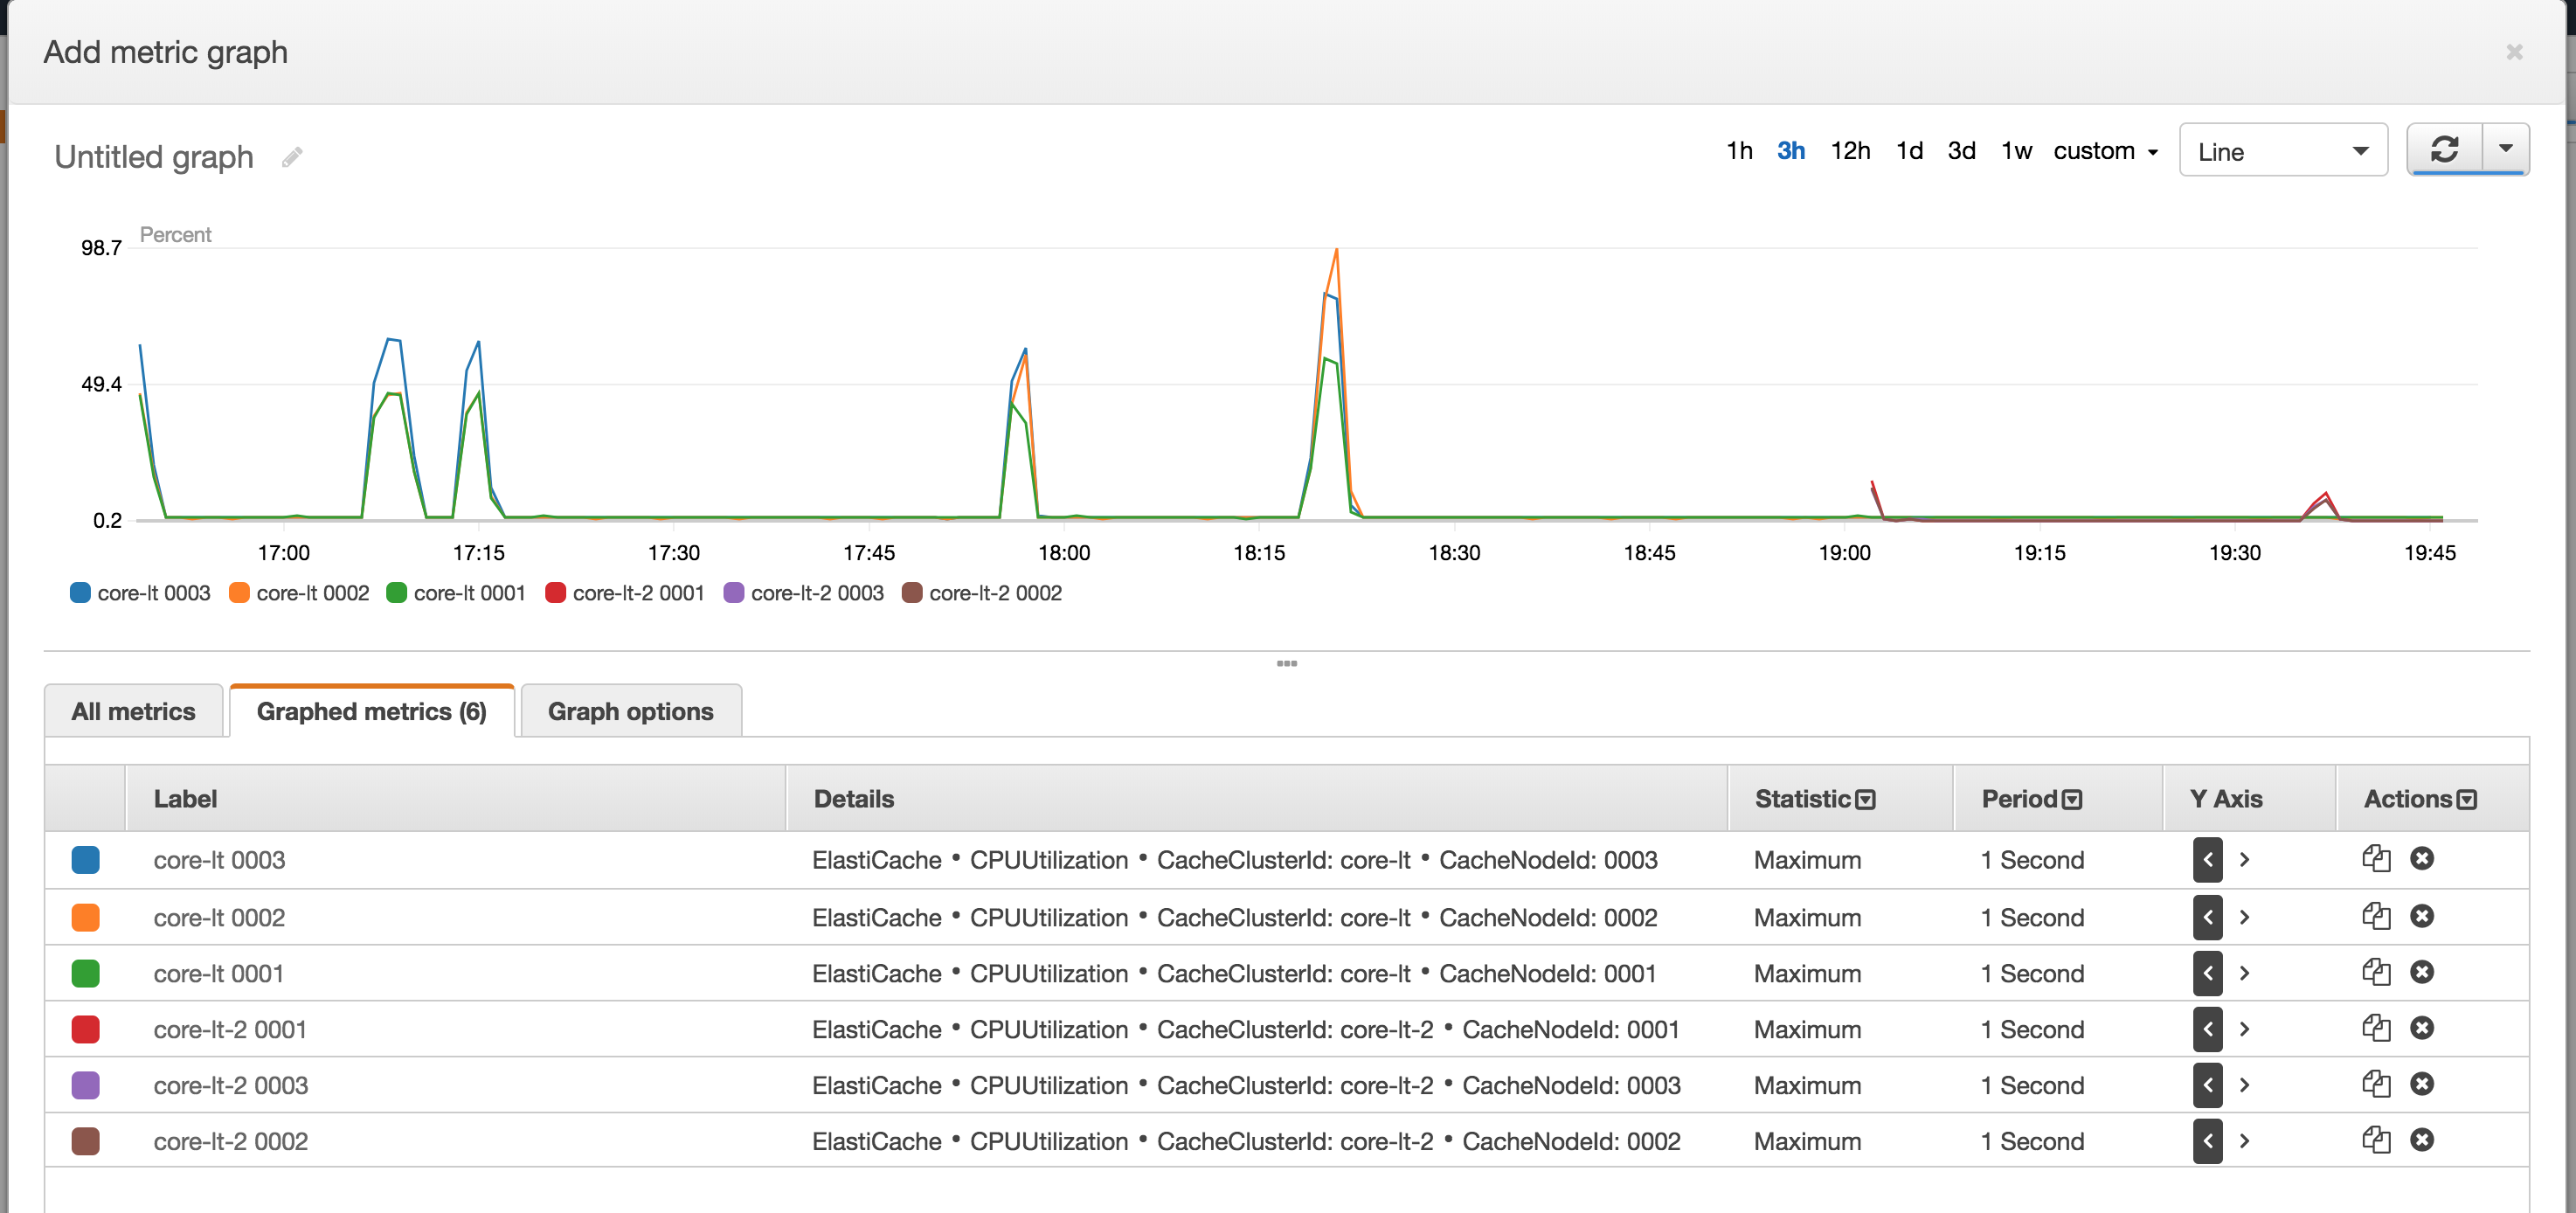
When we needed to dig even deeper in to hardware specific issues CloudWatch was extremely useful. There are a vast amount of metrics across the various AWS properties that help discern where potential issues might lie. For us being able to see the amount of queries against writer and reader databases in our RDS cluster was particularily valuable. This enabled us to focus on reducing load on the writer database via moving more queries to the writer or making better use of caching in other areas like Redis.
As an example below shows the CPU usage in various nodes of an Elasticache cluster during load tests.
Final Thoughts
The groundwork for getting a load testing system in place can seem daunting at first. It may require a fair amount of code updates just to make your app more portable. Then on top of that you also need to write the actual load tests, too. Finally, once you have it all up and running it can also be very expensive since you are essentially doubling your entire infrastructure.
However, once you get over these hurdles it becomes pretty invaluable. Running load tests on a regular schedule can help ensure you haven't deployed anything recently that affected your scalability drastically in any way. If you have large traffic events coming up you are aware of it can help give confidence in your ability to perform at scale.